
SAP Analytics Cloud: Analytics Designer is a tool in SAC that allows you to create advanced analytical applications.
Its use allows, like the SAC stories, to visualize its data in order to analyze it. However, Analytics Designer allows you to incorporate scripting in order to customize your visualizations, which gives you greater freedom in the development of your application.
If you are familiar with Lumira Designer (LD), you will not be lost in discovering Analytics Designer. Indeed, it includes many features present in Lumira Designer, making it easier for developers who know LD to get started (widget settings, scripting, CSS, etc.).
From Lumira Designer to Analytics Designer
According to the roadmap published by SAP, a new version of SAP BusinessObject named SAP BusinessObject BI 2024 will allow users to keep an on-premise version. This will not be the case for SAP Lumira Designer which, after 2024 (or 2027 depending on your BI version), will only be a memory and no new major update will be released afterwards.
Rest assured, all your applications will remain available for reading via the cloud.
SAC Analytics Designer is cited by SAP as the heir to Lumira Designer. Indeed, the number of functionalities that remain the same between the two tools is uncountable.
However, it is important to note that SAP does not provide a method for continuing to develop on Analytics Designer an application originally created on Lumira Designer.
In other words, if you want to make changes to an existing report on Lumira Designer, you will have to rebuild it from scratch on this new tool.
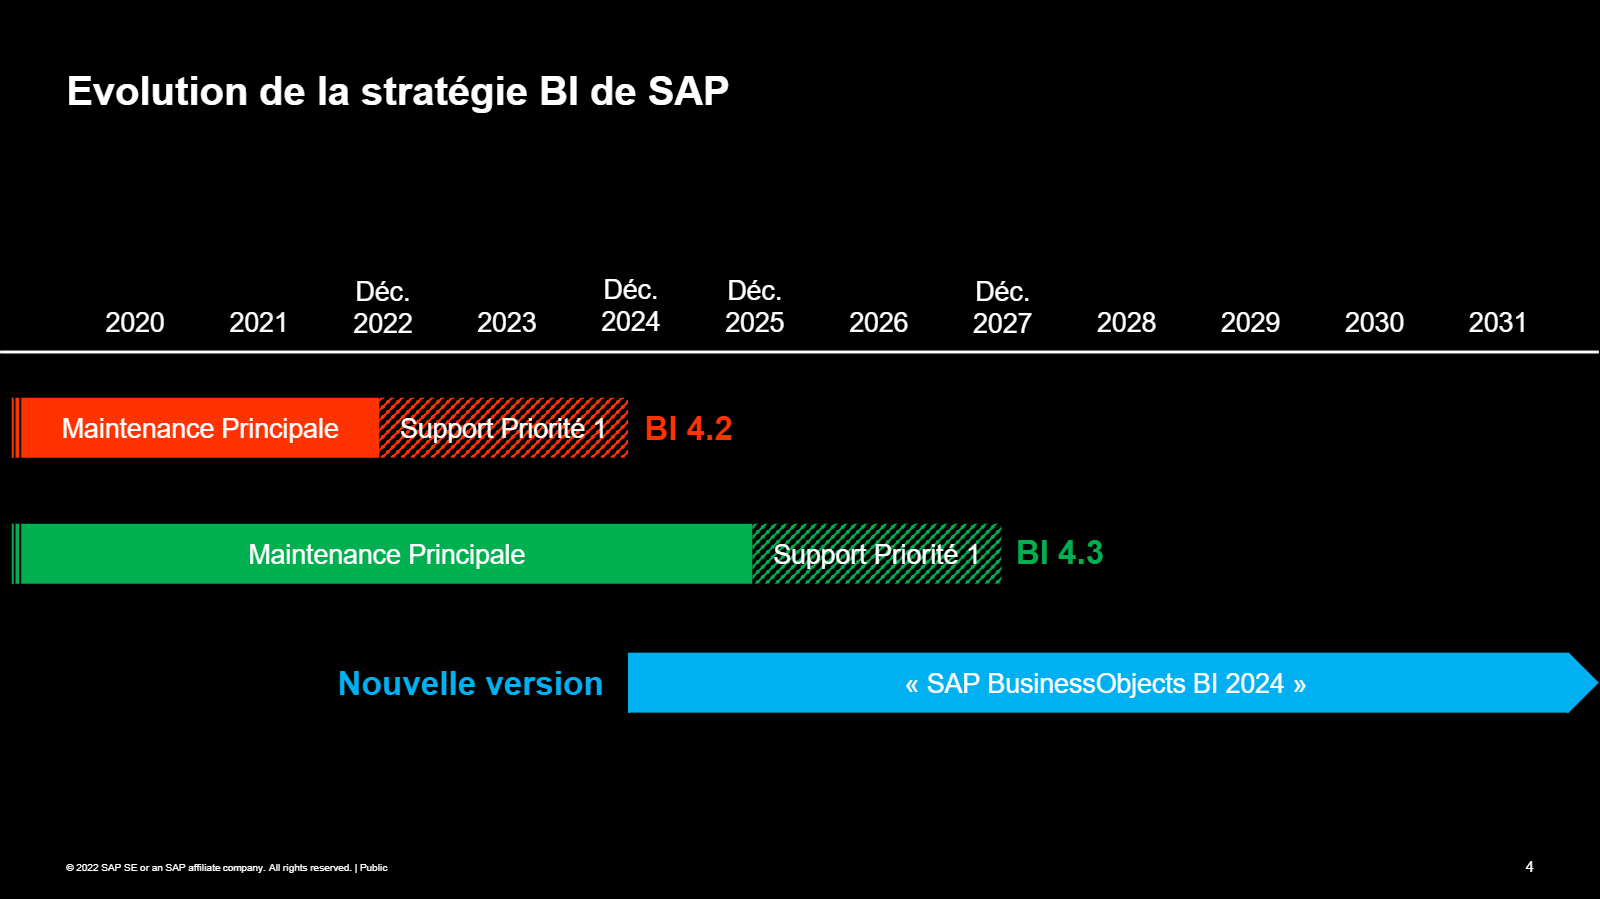
SAP BusinessObject Roadmap
Creating an application and describing the interface
If you wish, SAP offers a trial version of SAC, to access it click here.
A little practice: to create an application, simply go to SAC, Analysis Tools tab and click on Create
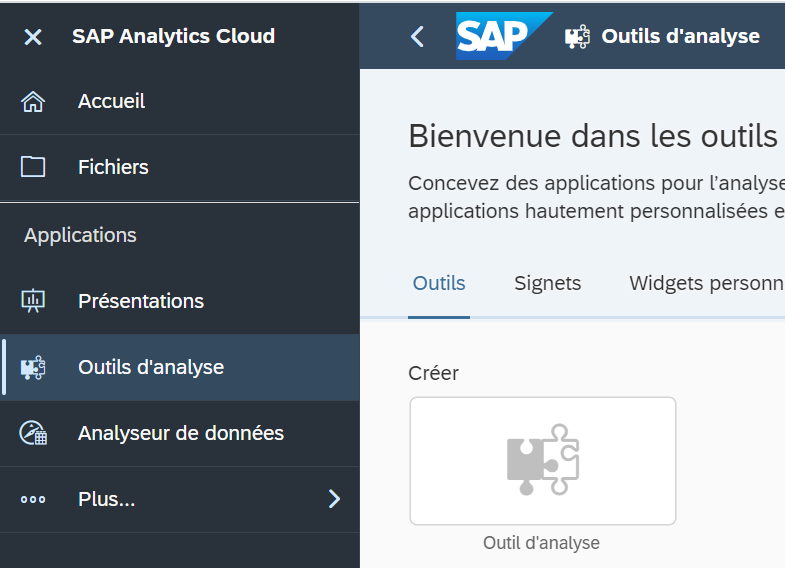
SAC Menu
You can also go to the tab Files click on ![]() and select Analysis Tool.
and select Analysis Tool.
The screen is then divided into several areas:
- The toolbar: Settings, saving, sharing, tab/graph insertion etc.
- Outline: List the elements that make up the application
- Canvas: Visual representation of the application and its components.
- Device choice: Allows you to simulate the opening of the application on various devices (Ipad, Iphone, laptop, etc.)
- Error and reference list: Indicates if there is an error in a script, or which script (or scripts) are associated with the selected item.
- Style or Builder: Allows you to set up the selected widget.
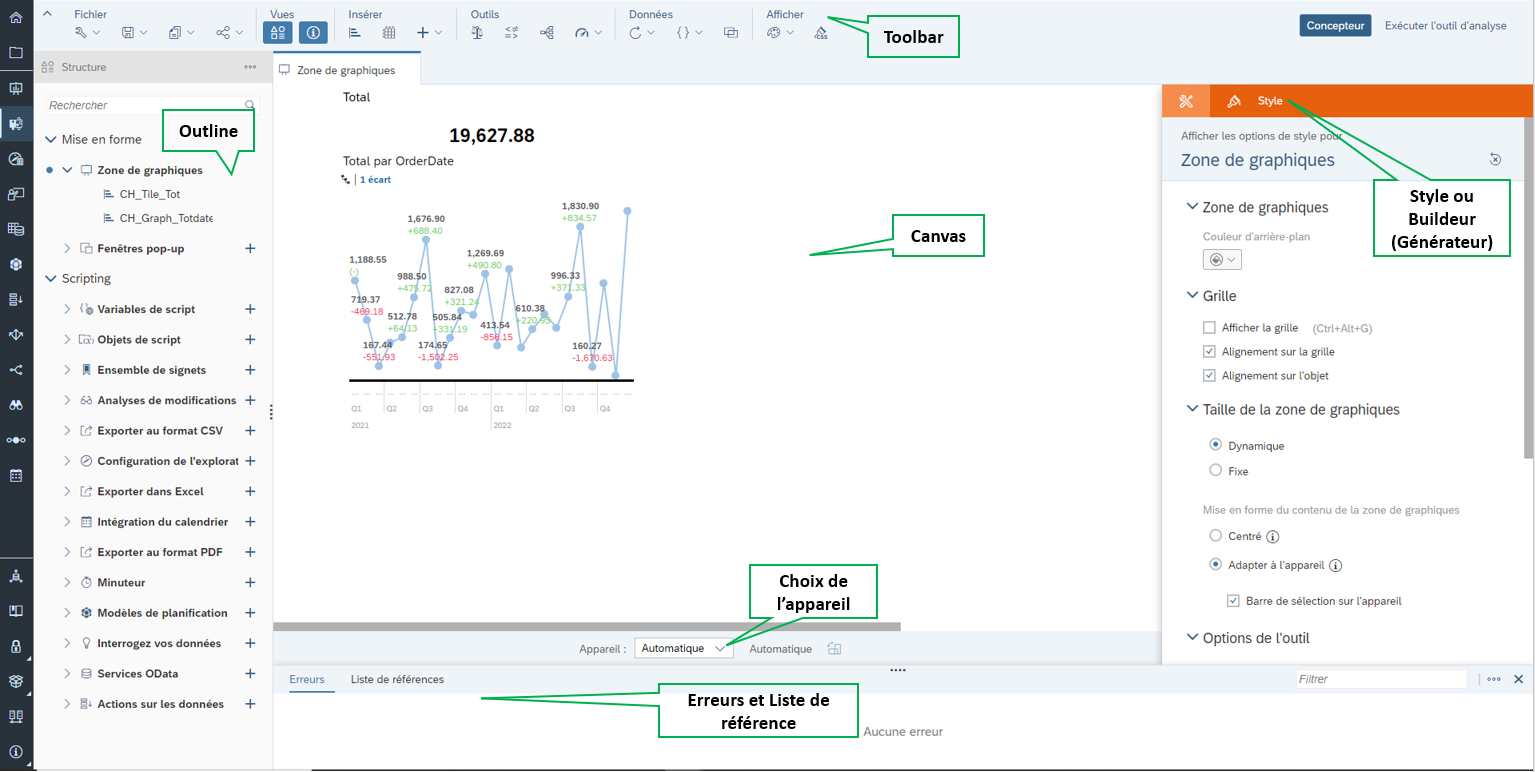
Visual Page SAC Analytics Designer
How to add and set up a widget?
In the Toolbar, select the element to add, graph or table, or click on ![]() to display all available widgets. The element should automatically incorporate the Canvas.
to display all available widgets. The element should automatically incorporate the Canvas.
To set up this Widget, it happens in the panel on the right of the Generator/Style screen, if the panel is not visible, you can open it using the Designer button at the top of the screen.
The Style tab allows you to set the size of the widget, the font used, the colors when it allows it, etc. Everything that can affect the visual of your widget.
The Generator tab is used to define the desired data source, choose the dimensions and measurements for a graph, the columns and filters for a table, or the values to be displayed or to be set by default in a drop-down list for example. Everything that concerns the functioning of your widget will be in this tab.
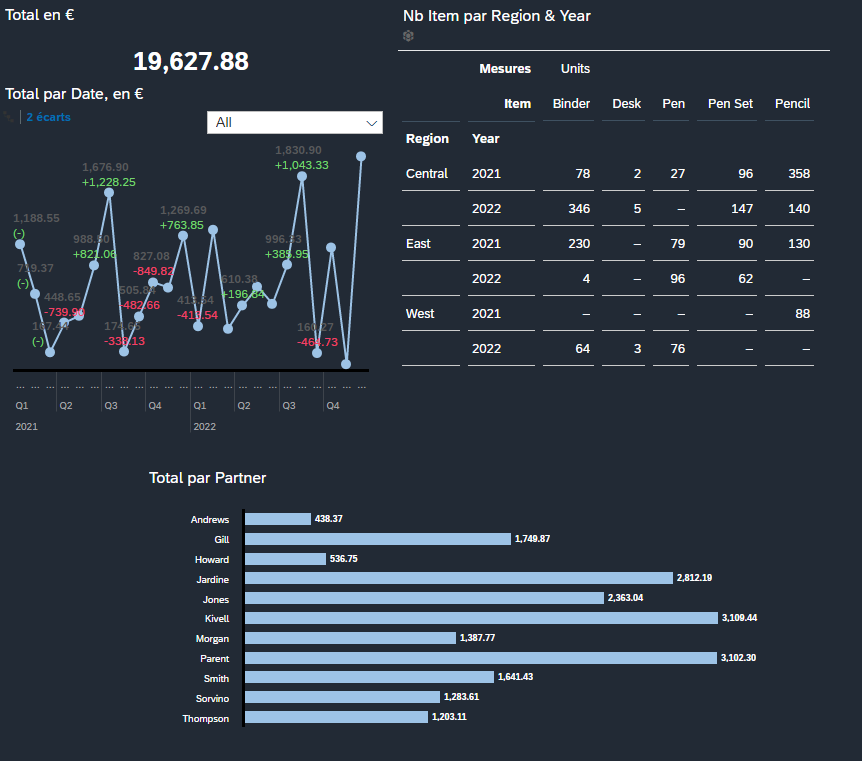
For the example, we decide to add a graph representing the total sales volume of a store over time.
We click on ![]() to add a graph to our Canvas, then we assign it a data source via the designer (tab Generator).
to add a graph to our Canvas, then we assign it a data source via the designer (tab Generator).
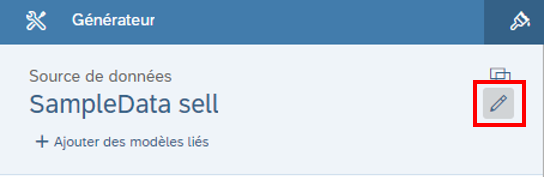
Edit Data Source button
We then start the construction of our graph by indicating the x-axis/ y-axis, colors, filters etc. We size it, either by hand or by using the Style panel.
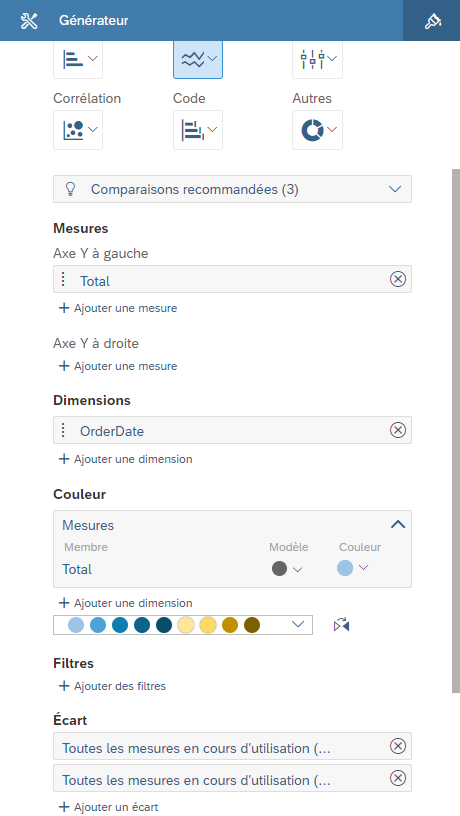
Builder menu
Congratulations, your first widget is created! You are now able to insert a widget in your application, the method is the same or not so different for the others. Why not try some others before moving on?
Why use SAC Analytics Designer?
As said in our first paragraph, the interest of this tool is to be able to use scripting to customize the whole application. These different customizations will allow your customer to have a custom application, which answers to requests that can be very specific and corresponds to his expectations.
For the connoisseurs, the code used for the script is very close to JavaScript but it is not at all necessary to have a big JavaScript developer package to understand the mechanics. In fact, SAP has incorporated a very functional input help (like for Lumira Designer) in the script editor.
How to customize your application?
Each widget you decide to add to your application can be associated with its own script.
This script gives you complete freedom to make changes to the application: linking several graphs, setting up dynamic filters, changing the size of the graph, adding columns to a tab, etc.
Example of customization via scripting
We are going to add a drop-down list ofitems to filter the graph using the script.
To start with, we add a simple drop-down list.
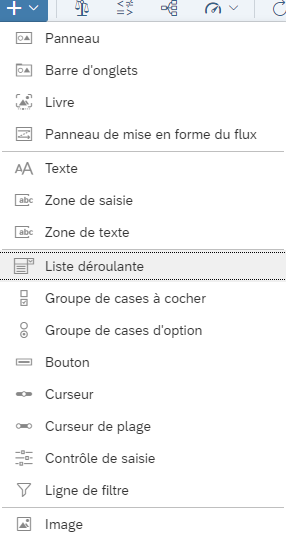
Add drop-down list
It is possible to fill the drop-down list in different ways (see the Drop-down list generator panel). However, we want the list to be filled automatically with all the items represented in our graph.
To do this, we create a script that will be triggered each time the application is opened.
Choice of the scripting event
A new tab opens, and it is in this tab that the scripting part takes place (at the launch of the application only).
The following script allows to get the Items present in our graph CH_Graph_TotDate and to add them in our dropdown list DD_Item.
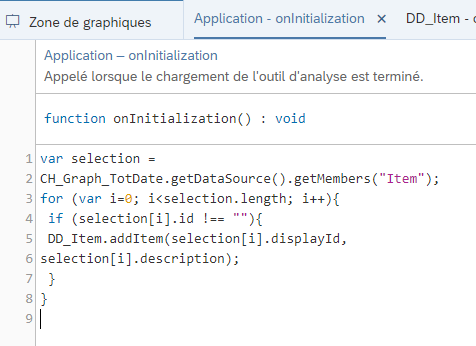
Script to fill the drop-down list
Then, we open the script associated to the onSelect of our drop-down list. This script will remove all the filters from the graph if the "All" option is selected and place a filter on it if we click on an Item.
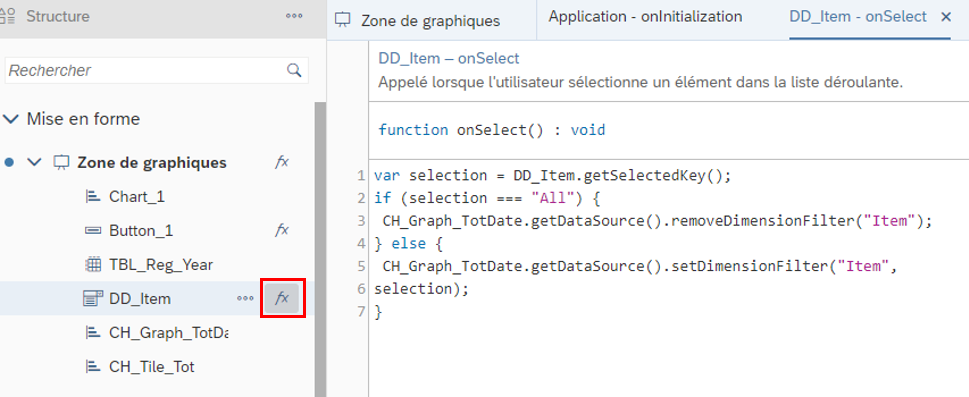
All management script
Finally, knowing that our graph does not have an "All"item, we will manually add the option to the drop-down list, this is done in the Generator panel of the list.
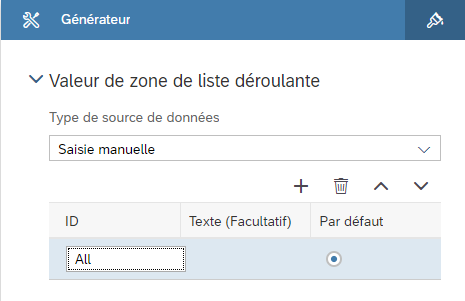
Add text "All
A small test of the drop-down list by clicking on ![]() it can be observed that all the items are present and that the filter is working properly:
it can be observed that all the items are present and that the filter is working properly:
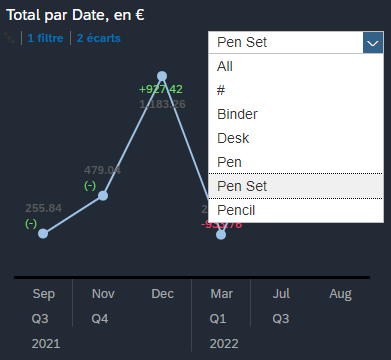
Test of the drop-down list
Further customize your application with CSS
The customization of the application does not stop at scripting, it is also possible to customize the design of each of our widgets with a CSS sheet.
You can create, or import a CSS sheet on the application, then define in the Style panel the class to assign to your widget.
The CSS sheet also has a very useful help listing all the customizable elements for each of the widget types.
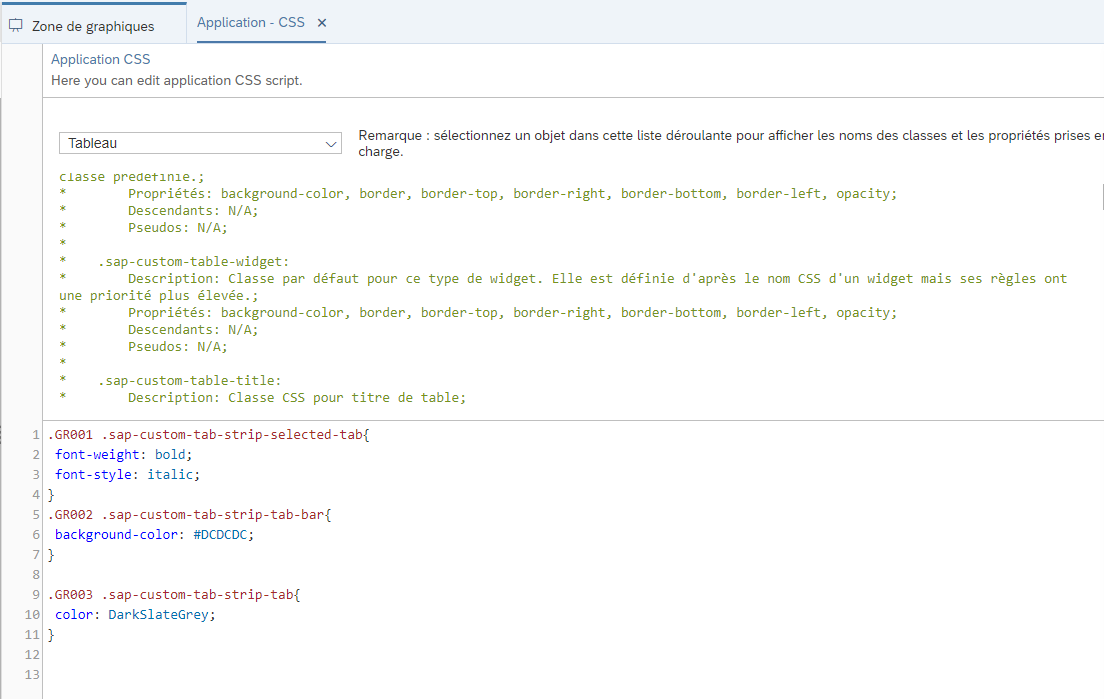
Example CSS page for table
Some additional information.
Data source:
- There are two types of connection possible on SAC Analytics Designer: live or import
- It is possible to define, among other things, as a source: an SAP HANA model, a Bex query, or an SAP Analytics Cloud model...
Compatibility:
- The Chrome browser is strongly recommended for the use of SAC Analytics Designer, the use of its debugging console is emphasized during the training sessions on the tool in order to bring an additional help to the developers.
- Microsoft Edge, Safari and Firefox are also compatible according to the matrix provided by SAP(link)
Conclusion
Together, we've gone over some of the many features of Analytics Designer.
Now it's your turn to create custom applications that fit your needs.
You'll learn the most by developing your own application! However, to give you an idea of what you still have to discover and what is possible, here are some screenshots of the menu of widgets, functions and other elements available so far in the tool.
Moreover, I invite you to consult Guillaume Regnier's article on CDS Views, one of the sources that can be used on SAC Analytics Designer, which could be a good complement.
Finally, if you want to learn more about the SAP Analytics Cloud tool: Analytics Designer, here is the link to the latest version of the developer manual by SAP.
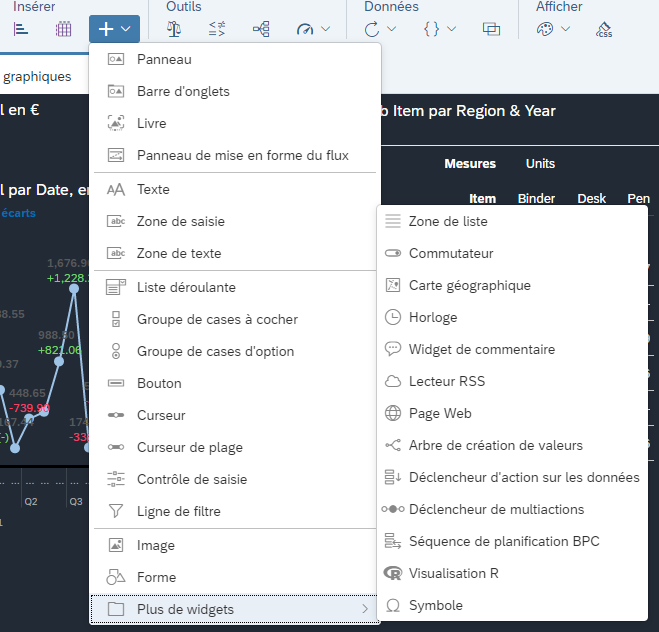
Widget list
Different types of graphs
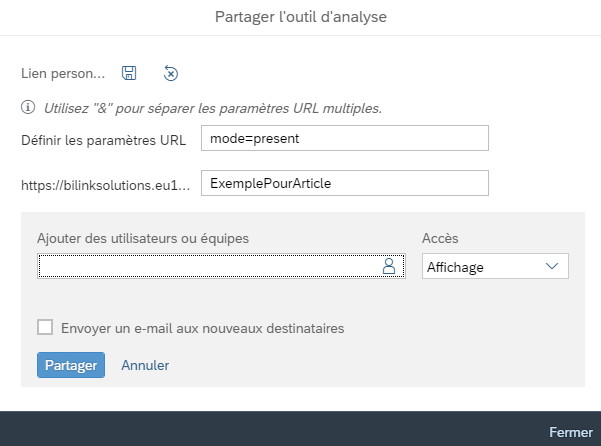
Application sharing menu
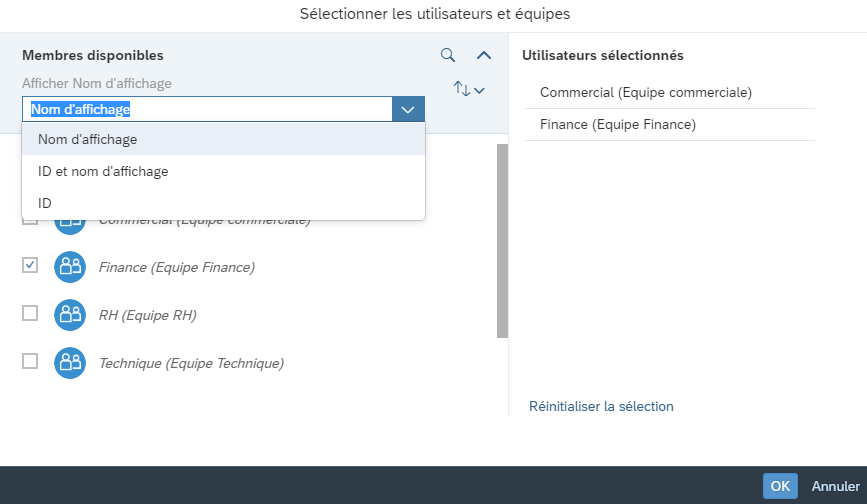
Share list