
In 2017 Lumira Desktop (1.31) and Design studio (1.6) converged under the name Lumira 2.0, in the process their evolutions are renamed Lumira Discovery and Lumira Designer respectively.
For more information on Lumira Discovery, please see Geoffroy's article on the subject:
https://www.bilinksolutions.com/blog-data-visualisation/sap-lumira-discovery-20/
Here we will present some key points of Lumira Designer as introduced in its version 2.0 as well as the new features brought by the latest version 2.1 (December 2017).Lumira Designer is primarily an interactive dashboard designer.
Unlike Discovery, Designer is not a tool designed to be made available to users, its comprehensive interface is reserved for advanced designers. The tool nevertheless assists you in most of the advanced functions and does not require you to be an experienced programmer to create dynamic features.
Numerous standard components are available, and it is possible to integrate or develop new ones:
- Tables and graphs allow the data to be visualised.
- Basic filters and components interact with components or data sources.
- Finally, containers are used to format the application using page or tab functionalities, for example.
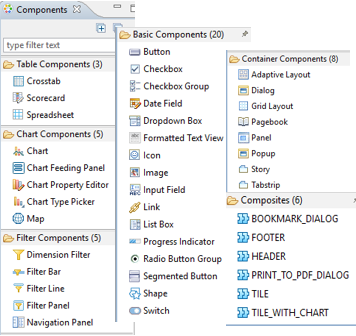
Fig. Components
Some features to remember:
- Binding will allow components to be linked together without having to use scripts. It is therefore possible for a filter on one component to also affect another.
- Events" are triggered by predefined actions, such as clicking on a button or selecting a row in a table, and it is then possible to execute a script according to the event and its context.
- Composite applications" are applications whose sources and attributes are undefined; these will be filled in by variables when an instance of this composite application is added (by binding or scripting). It is therefore possible to build a small library of reusable applications, even several times in the same dashboard.
- Adaptive layout allows you to predefine the layout behaviour of your application according to the user's screen size, which ensures a good display of the dashboard on mobile and tablet devices.
The key new features of Lumira designer 2.1 :
- Dynamic creation of components at runtime
It is now possible to dynamically add components to the application, based on a query result for example. So if you can't anticipate the number of customers per region, or whatever, based on the filters in the report, then it will be possible to dynamically create a thumbnail for each customer.
This is especially interesting with the use of composite applications, and the copying of component properties by script.
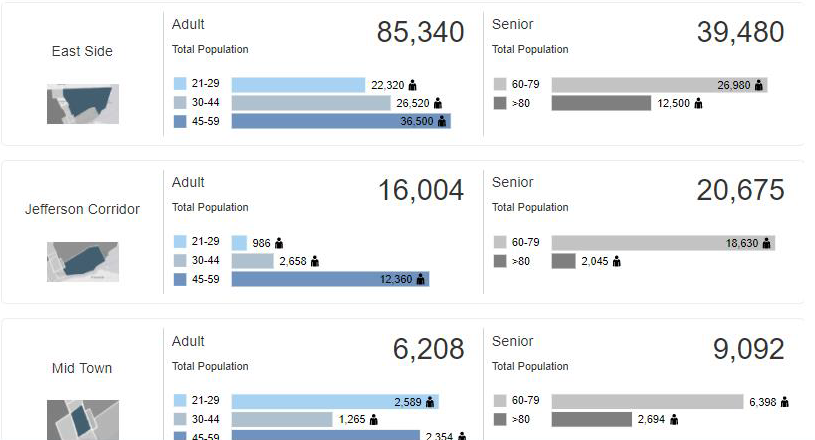
Fig. Dynamic creation of components at runtime
- Filter on indicators
A classic feature that has been missing until now is the ability to filter according to indicator values. It is important to see here that the context of the filter can be specified, so the first filter applies to the aggregate amount for each country, while the second applies to each dimension of the datasource.
Fig. Filter on indicators
- Better conditional formatting
The only conditional formatting managed until now was that of Bex queries, the good old "green/yellow/red" colour code applied to key figures. With this update, we can really talk about conditional formatting. These now apply to indicators and dimensions, and are managed as a technical object applicable to tables and graphs.
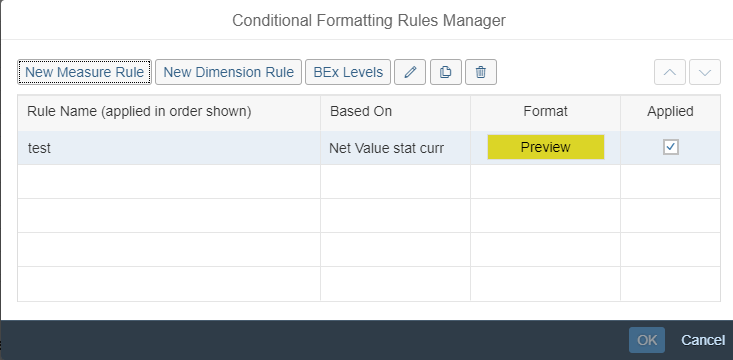
Fig. Conditional formatting
- Advanced comment management
BI comment management catches up with other tools here, with support for comments by application/report, but also comments by data context. Each comment has a private/public privacy setting. All of this integrated into the BI platform's comment management.
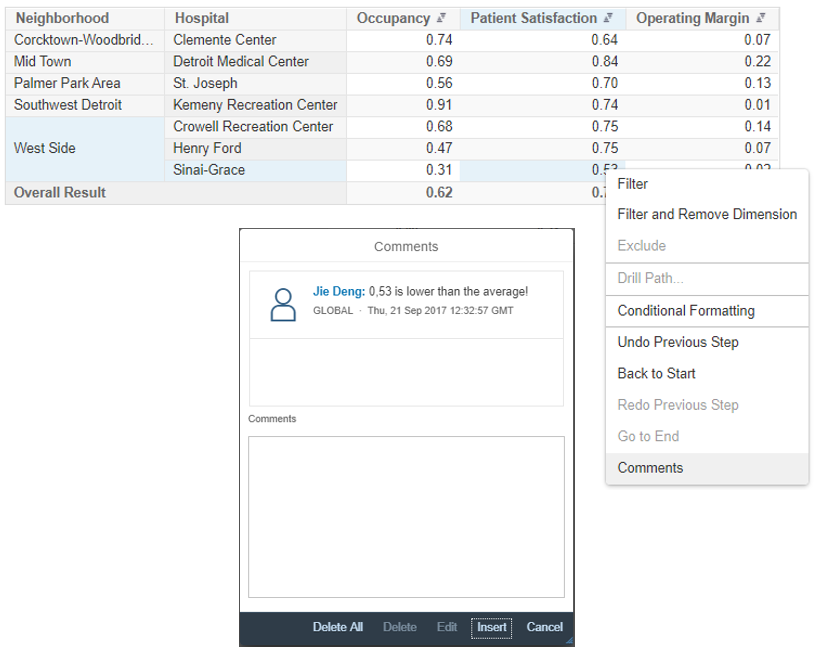
Fig. Comment management
In a nutshell...
...Since the austere and technical interface of the Design Studio version, Lumira Designer has been considerably enriched and, above all, simplified, with the appearance of many native functions that would have required scripting at the time.
SAP has also worked a lot on the dynamic aspect of the reports, which are less and less "pixel perfect" and more towards renditions that adapt as much to the content as to the container, which is the display browser.
With most of its shortcomings addressed, initial customer feedback on Lumira Designer 2.1 has been very positive. The creation of a demonstration with a "wow" effect is easy to do, so it is definitely a tool to consider for interactive dashboard needs.