
If, like me, you have been working in the field of business intelligence for more than ten years, if you have had the opportunity to support clients of all sizes, you will have felt the wave of change linked to the data business.
Behind the sometimes overused term "digitalisation", we have seen the rise of the world's largest capitalisations in less than 10 years thanks to the value of the data they possess; demonstrating the strategic importance of this data. In addition, we can see the robotisation of business and IT processes or the discovery of relevant information via artificial intelligence.
What does this mean to you as a BI Manager?
Let us first look at what is expected of IT teams and systems. We will then discuss the new uses and changes in the application landscape that have been necessary to enable these developments.
1 New expectations
With the advent of SaaS BI platforms (Power BI, Qlik Sense, SAP Analytics Cloud...), building graphical reports is more than ever within the reach of business teams. Building the data warehouse or semantic layers, on the other hand, remains an activity for IT experts.
However, the time and budgets allocated to these essential tasks are shrinking in the face of expectations for greater efficiency.
1.1 Agility
It is difficult to justify taking several days of work to expose raw data from source systems, perform joins or extend table contents. The business expects greater agility as this allows for innovation.
Below is a non-exhaustive list of developments that have increased agility and the ability to deliver quickly:
- Silo modelling to avoid regression => Qlik Sense applications
- Technologies that allow replication of tables without development => SAP Hana
- Virtualisation mechanisms to associate sources without copying them => Denodo
- In-Memory performance => Qlik Sense & SAP Hana
- No-SQL" links allowing logic without modelling => Mark-Logic
- Building reports on transactional systems => Embedded Analytics
1.2 Real time
Another need is the need to report on refreshed data sources in real or near real time. These issues arise in the context of the annual closing on operational and other reports.
Hana and SLT (SAP Landscape Transformation Replication) technologies now enable this replication by exposing ERP sources in near real time.
Alternatively, reporting directly on the ERP layer via Embedded Analytics concepts is becoming the new target for real-time reporting.
1.3 Mobility
Use cases related to mobility are frequently present whether it is for "Manufactuing Execution System" or for managers who want to have their state "Anytime, Anywhere". Cloud or SaaS solutions are the best solutions for mobility. However, SAP, Qlik or Microsoft applications all have mobile applications.
1.4 Automation
The automation of more and more office tasks is expected by the business because it allows new gains in competitiveness. This is becoming possible with the concepts of RPA (Robot Process Automation), and more generally with the data integration buses and platforms that we will discuss next.
Taking finance as an example, here are some examples of tasks that can be automated:
- Extract a profit and loss account and perform basic checks
- Load this income statement into a consolidation tool
Any manual, repetitive and deterministic office task can be automated via an RPA process. This step initiates the creation of an interface that is a more robust solution than RPA.
1.5 Artificial Intelligence
Artificial intelligence is embedded in the new BI tools. For example, SAP Analytics Cloud allows the search for criteria or analysis axes that have the greatest influence on the analysis of an indicator. These functionalities are increasingly sought after because they allow you to get a foothold in data science. These new expectations are expressed through new uses that we will explore in the following chapter.
2 New uses
Ten years ago, innovation was achieved through the implementation of Dashboards: the synthetic and graphic evolution of detailed analysis reports. More recently, with the multiplication of sources, the uses have become more advanced and more scientific
2.1 The genesis: Corporate reporting
The first need of a company, whether listed or not, is to have statements that allow it to manage its activity by evaluating past activity:
- Produce an income statement or balance sheet for the past year?
- Volume of purchases?
- Stock levels?
- …
All these questions and the reports that answer them are to be classified as "Corporate Reporting". This is the starting point on the BI maturity scale.
2.2 Multiplication of uses
More recently, the development of "In-Memory" and Web technologies have made it possible to democratise data exploration and visualisation tools.
Data Visualisation
Below is an example of a visualisation tool with SAP Analytics Cloud that allows for intuitive data exploration.
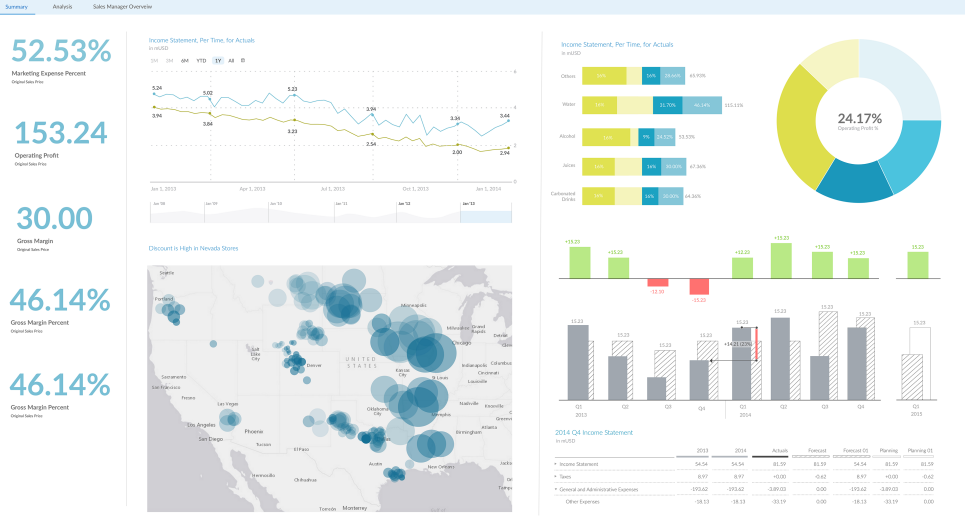
DataViz (Data Visualisation) tools allow the user to graphically explore a DataSet while interacting with the report. This is made possible on hundreds of millions of rows thanks to "In-Memory" technologies.
In DataViz tools there are multiple sub-categories:
- Frozen Report
- Free Analysis
- Dashboard
- …
Simulation
Simulation is a very different exercise, often referred to as 'what-if analysis'. The questions addressed by these uses can be :
How do you manage production if you win a new contract?
What will be the impact on profit if the cost of raw materials varies?
In short, these tools can be used to simulate the impact of decisions or variations in external parameters.
Anaplan is an expert in the market, of which the following is a visualization:
Data Science
Data Science is the term used to describe the analysis of data using mathematical or statistical processes. These statistical analyses make it possible, among other things, to predict the future based on learning from past patterns. This branch of Data Science is called predictive analysis.
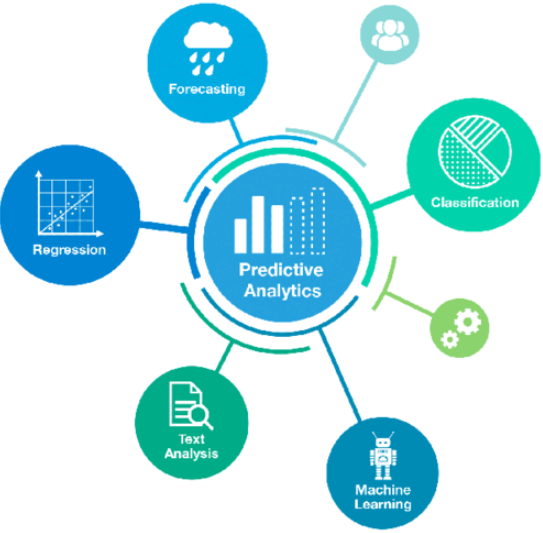
Data Science is often linked to Machine Learning and Data Mining. These scientific methods include the following processes:
- Supervised learning (classification - regression)
- Clustering
- Dimensionality reduction
- Structured prediction
- Anomaly detection
- Artificial neural networks
- Reinforcement learning
To meet new expectations and new uses, the application landscape has been enriched over time.
3 The evolution of application landscapes
3.1 When the Datawarehouse was the top layer of the information system
Historically the diagrams and the representation of the data flows were always aligned with the following model: Data Source => ETL => Data Warehouse => Reporting layer.
The main idea was the rationalisation of all data in the same data warehouse for efficiency and uniqueness of data storage.
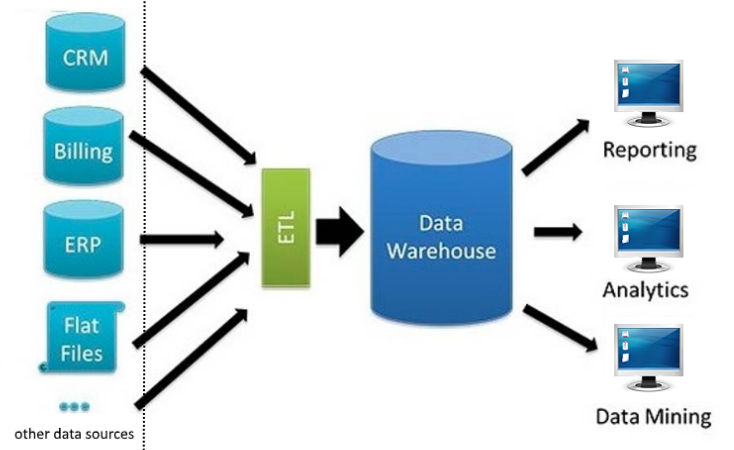
However, these concepts proved to be too restrictive and the diversification of uses required a more flexible representation.
3.2 Data becomes the core of the application landscape
The new data integration and consumption patterns have three fundamental differences from the previous vision: the data bus or integration platform, multiple data warehouses and virtualisation.
The diagram below is a view of the Modern Data Platform by SAP:
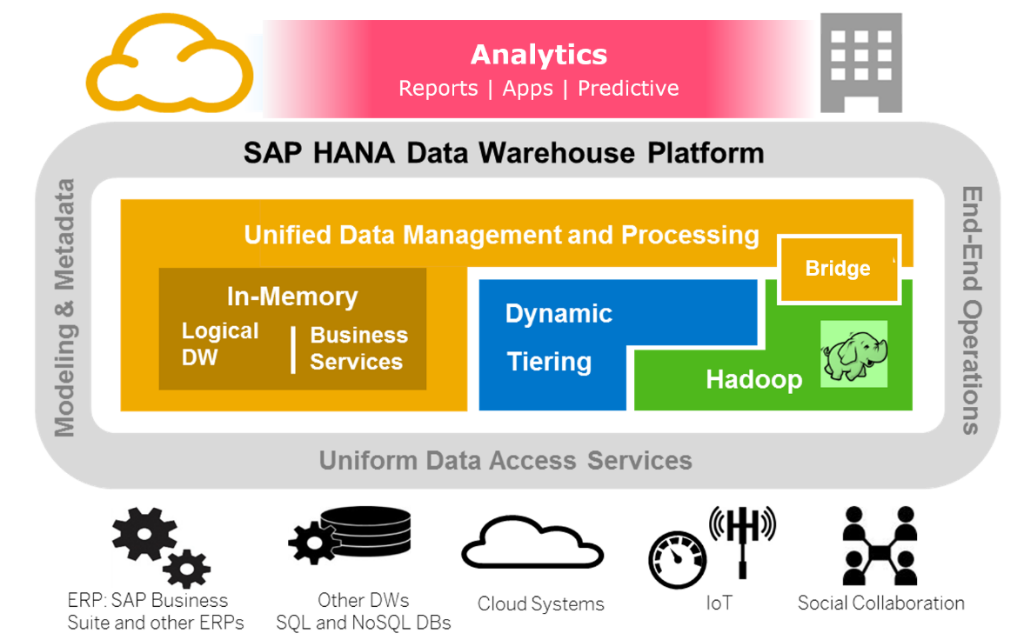
Setting up a "Data Bus" or "Integration Platform
A "Data Bus", "Integration Platform" or "Data Integration Backbone" is illustrated in the diagram above by the notion of "Uniform Data Access Service".
The concept is to set up a middleware that connects all points, whether they are source or destination. The integration platform is service-oriented and must be flexible. When the platform is configured, the use of webservices allows the propagation of data to be controlled.
The usefulness of the integration platform is reinforced by the multiplication and diversification of data sources, but also by the multiplication of storage platforms: In-memory, IOT, No-SQL.
Comparing the before and after architectures, we see the emergence of unstructured data such as IOT and collaboration tools, as well as data hosted in the cloud.
The "Dell Boomi" and "Kafla" tools are examples of integration platforms on the one hand and data streaming on the other.
Multiple Data Warehouses
Data warehousing platforms have specialised in specific uses: master data management, aggregate data management, real-time source data replication and unstructured data management.
To address the needs listed above multiple tools and editors are needed. Here are some examples of these tools:
- SAP BW: aggregated data
- SAP Hana: real-time data replication
- Mark-Logic : No-SQL databases
- Hadoop: data from IOT
- …
Comparing the before and after architectures, we can see the shift from one to several storage platforms.
Virtualization
The proliferation of storage platforms and reporting tools raises the following questions:
How can we create reports on multiple data sources?
How can views be implemented with a semantic layer that can be used by multiple visualisation tools?
The answer to both questions is the data virtualisation layer.
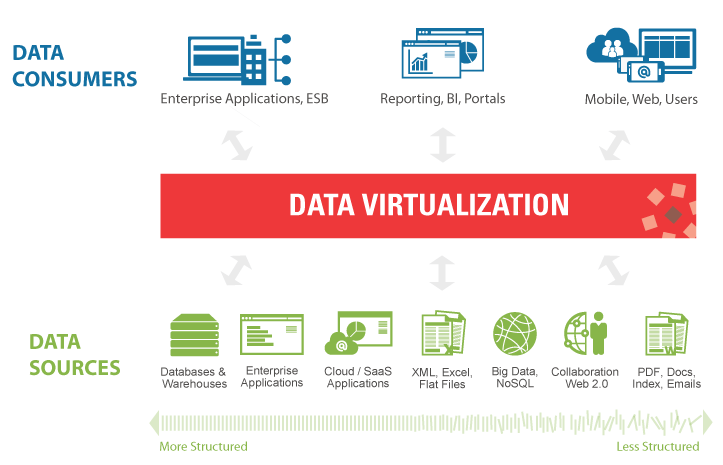
The illustration above comes from the virtualisation software company "Denodo".
The virtualization layer allows :
- Create a logical abstraction layer with the data source
- Create a semantic layer covering structured and unstructured data
- Agile provisioning of new data sources
- Provide unified data governance.
SAP Hana also provides the virtualisation capabilities to provision views on cloud applications such as Concur or SuccessFactor, or IOT databases such as Hadoop.
3.3 The role of the "Information Systems Planner
As we have seen together, the multiplication of tools and uses, the increased integration with data buses and virtualisation solutions require a real business strategy. The role of each application in the application landscape must be defined via a POS land use plan. This mission is carried out by the information systems planner.
4 Conclusion :
In conclusion, we can reflect on the use of data-related tools and ensure that they are used in the most relevant way in the application landscape.
Supporting new expectations through new tools requires frequent questioning of the scope of operation of these tools.
Moreover, as the famous saying goes, "the best is the enemy of the good", completeness of vision is one thing, but the ability to implement is another. The multiplication of technologies can have the adverse effect of making any execution complicated.