Inflection of the BI market
For several years now, the BI market has seen a shift in power from IT to the business. According to a Gartner study(Magic Quadrant for Business Intelligence and Analytics Platforms), business-driven needs such as analytical agility and user autonomy are challenging centralised, IT-driven BI solutions.
The evolution of technologies and services makes this vision possible (Cloud, In-memory database, HTML5). The concepts of self-service data preparation, data mining, user experience and agile content delivery are now part of the adoption criteria for BI solutions.
As a result, the critical functionality of a BI solution needs to be redefined. The new functionalities and technical evolutions concern the following areas
- Infrastructure (Cloud Services, Data Source)
- Data management (self-service data preparation, embedded ETL)
- Data analysis and content creation (Embedded analytics, Data mining, Mobility)
- Collaboration (sharing analysis)
With this new vision of the BI market, new players are emerging. For example, the publishers Tableau and Qlik have contributed to the evolution of this market with their self-service oriented visualisation tools.
SAP, listening to its customers and the market, has also embraced this vision and is well on its way to modernising its BI offering.
Over the past 5 years, several products have been developed based on new technological solutions and new market expectations: In-Memory databases, Cloud Computing, Mobility, Self-Service:
- SAP Hana Platform
- SAP Business Objects Cloud for Analyses
- SAP Business Objects Lumira
SAP Business Objects Lumira
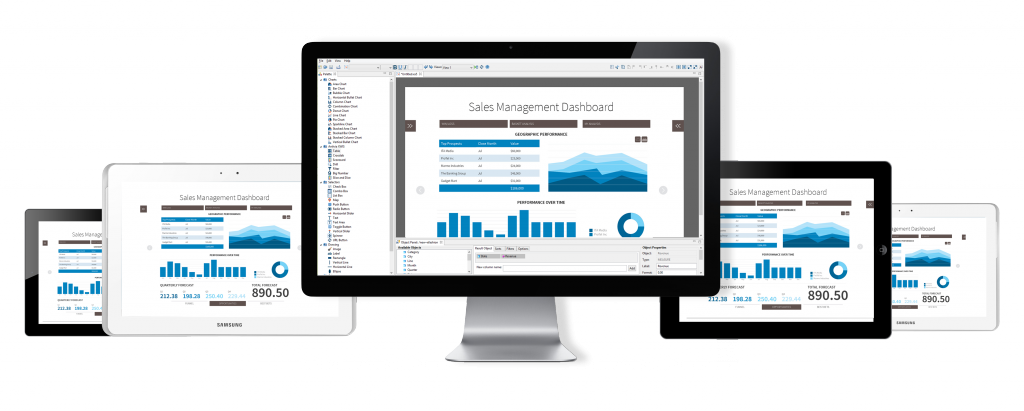
Lumira is a BI tool for data visualisation. Launched in May 2012, the product was designed for reporting on HANA databases.
Since then, the product has evolved to allow visualisation of other data sources and better integration with the SAP Business Intelligence Platform.
SAP seems to have created Lumira in order to respond to all the new problems of the market for data visualisation. The tool is designed for 100% self-service use, from data acquisition to reporting.
To create the report, the user installs the Lumira tool on his machine. Then he/she follows the following process:
- Data preparation: transformation of a dataset using an integrated ETL.
- Creation of visualization modes: creation of graphics from prepared data
- Report creation: integration of graphs into a structured report or an interactive dashboard
Each step is designed to be as intuitive as possible. It is not necessary to have any technical knowledge to develop your report with the associated data.
The data preparation module is the most interesting feature. It meets a recurring need: to allow the end user to develop his own ETL flow.
The user has the choice of extracting data from a variety of sources:
- Excel files
- SAP HANA
- SAP Business Objects Universe
- Hadoop
- Query bex
- Relational database (Ad hoc SQL query)
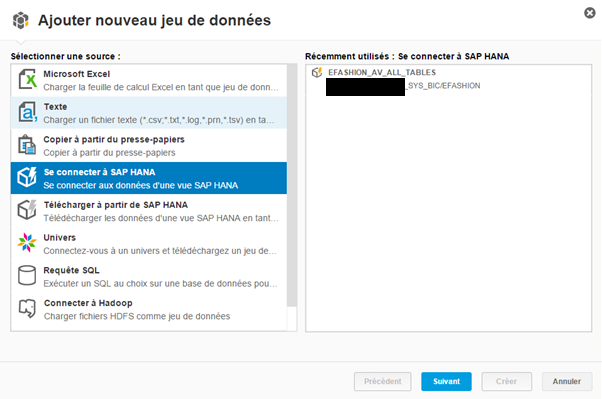
Fig 1. connection to SAP HANA
For example, in a few steps, we will extract data from an SAP HANA view:
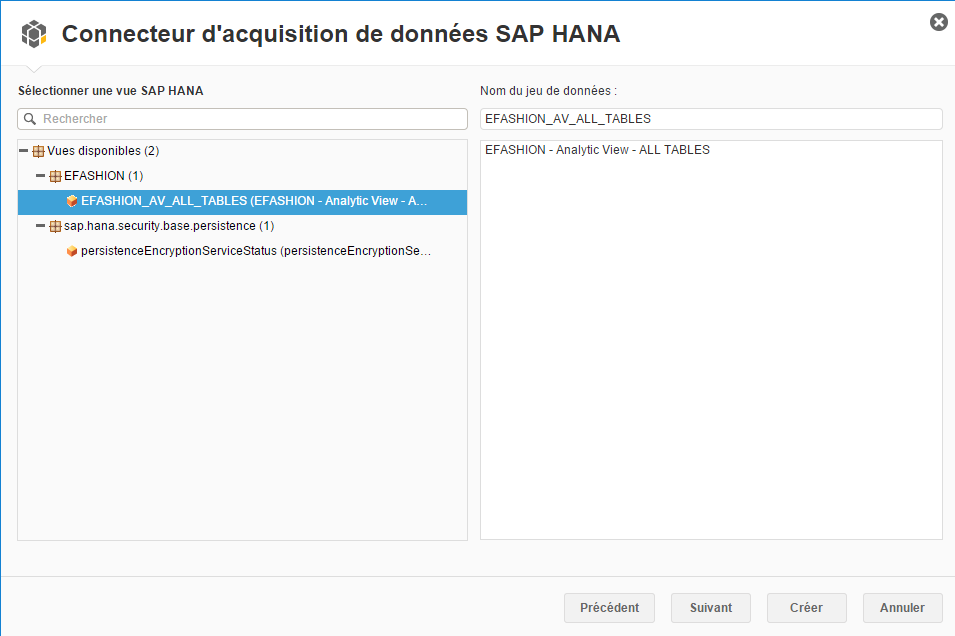
Fig 2: Selecting a HANA view
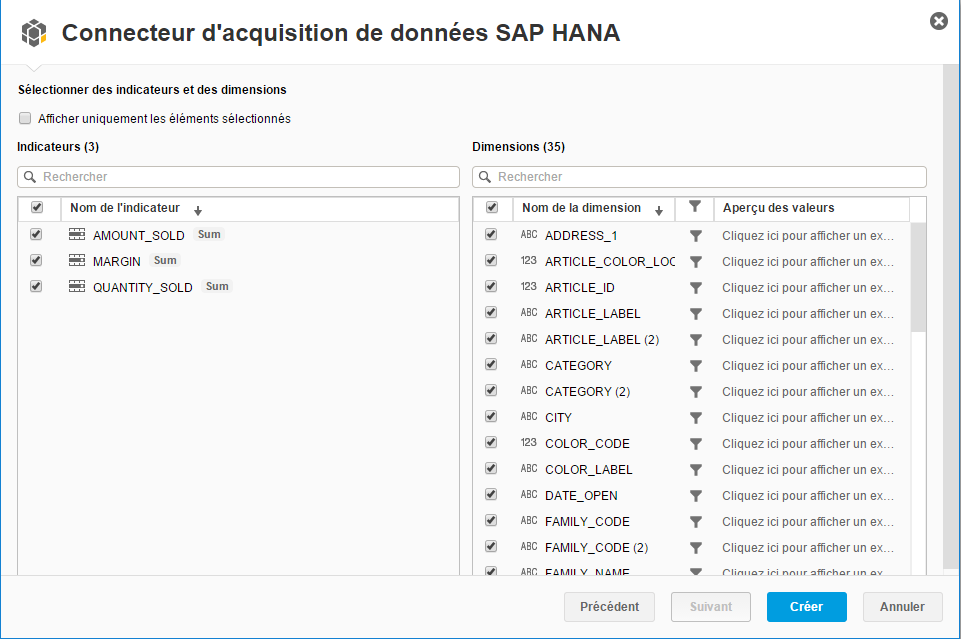
Fig 3. Selection of fields to be extracted
Once the data has been extracted, we move on to the preparation phase. It is possible to create your own transformations to implement a business rule.
For example, indicators are created in a few steps:
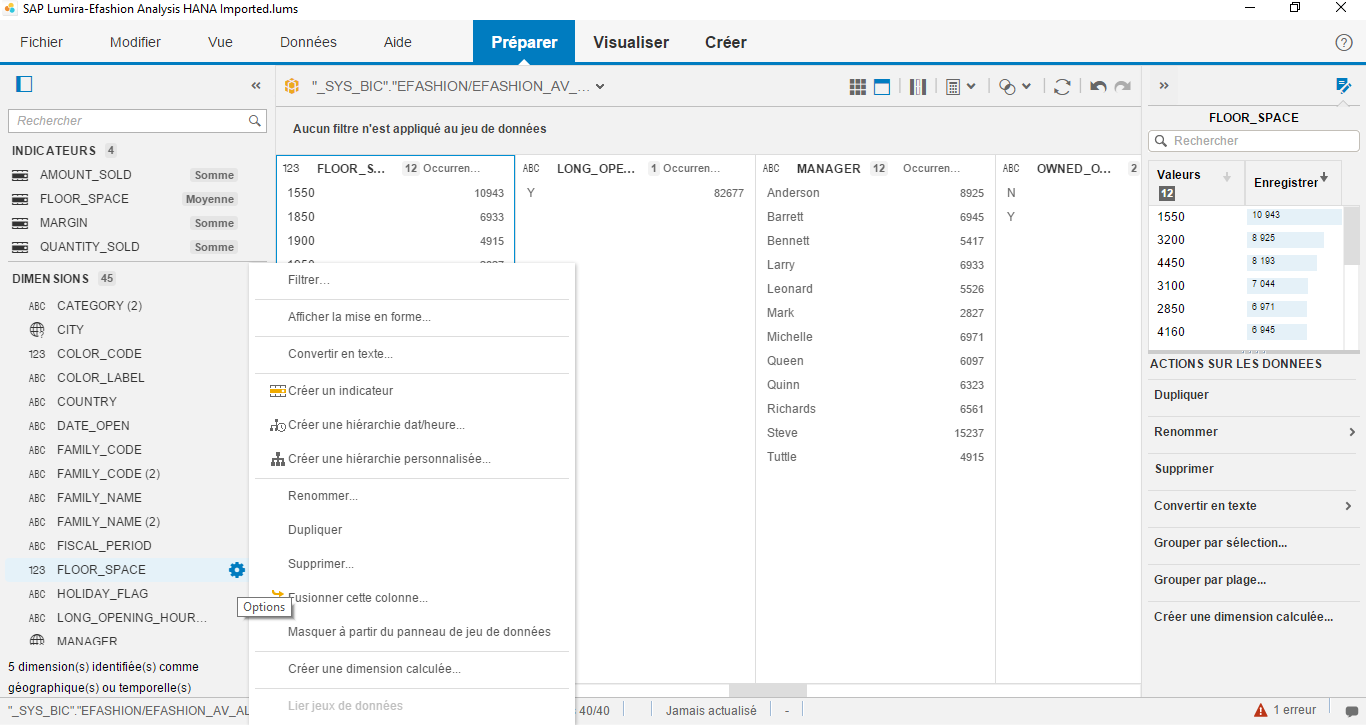
Fig 4. Selection of a field to be transformed
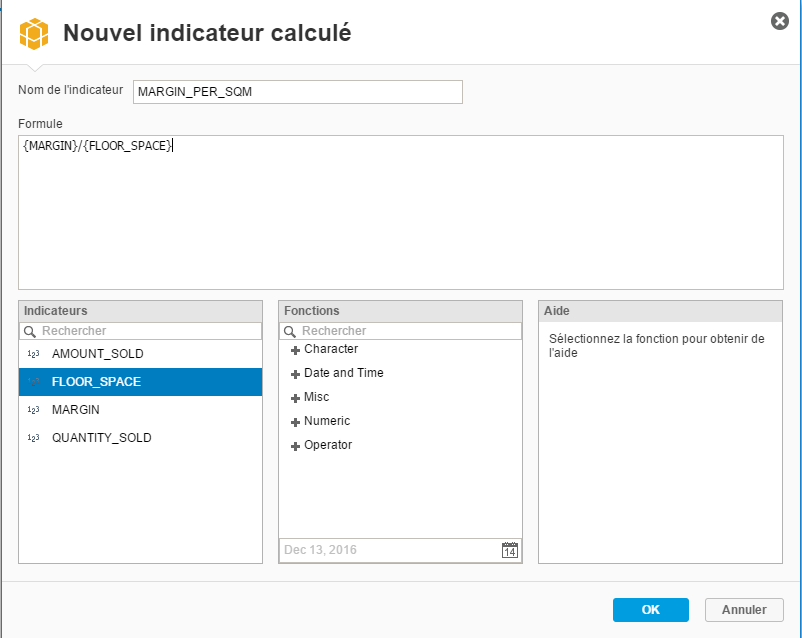
Fig 5. Definition of the indicator
The data preparation module offers wizards for creating hierarchies. One of the wizards offers the creation of geographical hierarchies, which can be used when visualising the data:
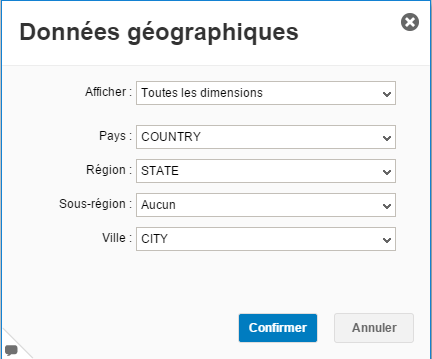
Fig 6. Definition of the geographical elements of the hierarchy
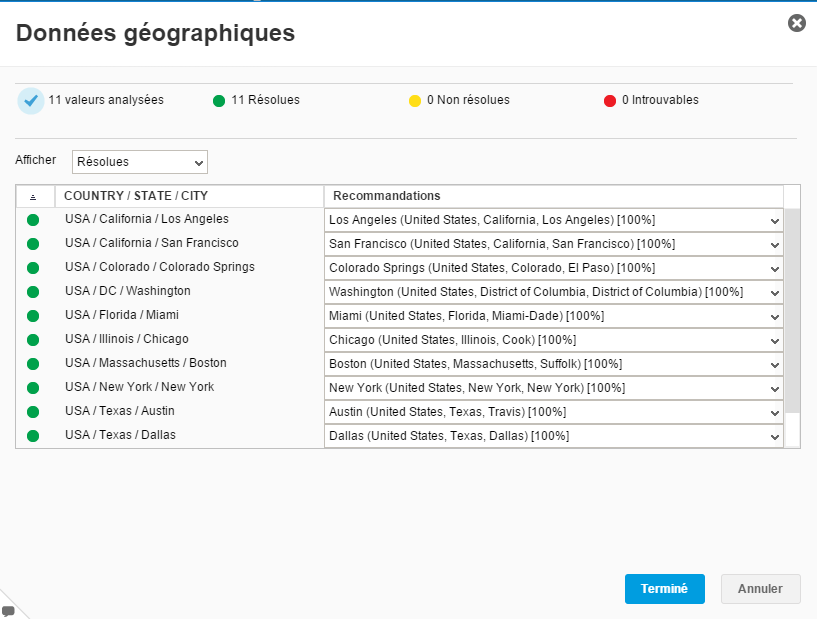
Fig 7. The wizard proposes to associate geographical data to the extracted data.
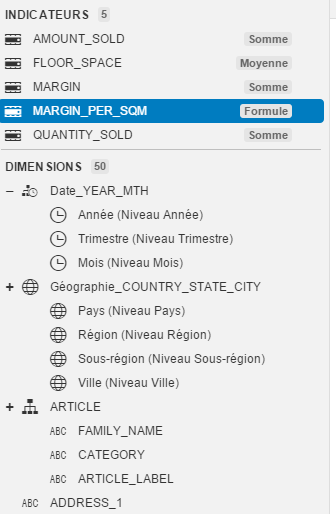
Fig 8. Possible types of hierarchies: Chronological, Geographical, Custom
The other creation steps do not bring any great novelties, nevertheless their ergonomics allows to compose reports with the prepared data in a few clicks.
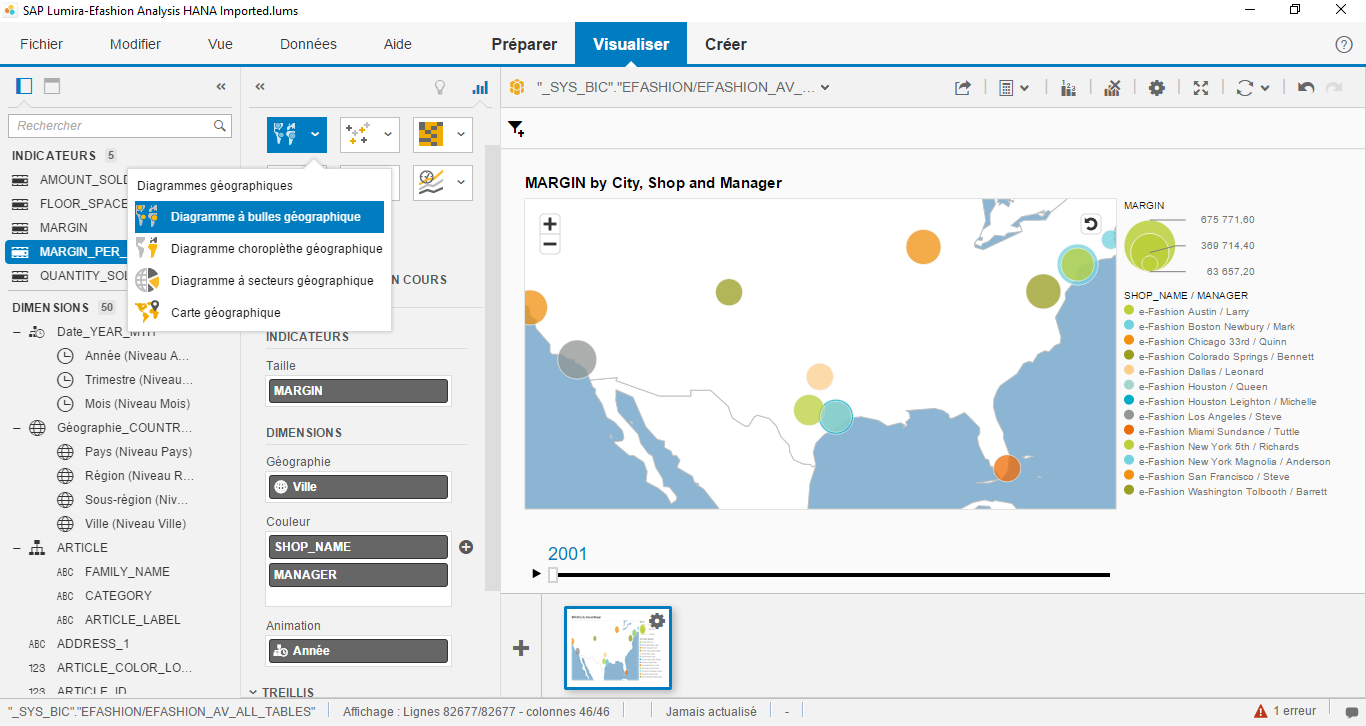
Fig 9. Using a geographical hierarchy with a map
What strategy for Lumira?
Lumira is part of a process of empowering users in business teams. Without any particular technical knowledge, a user has access to a complete decision-making chain (from data extraction to visualisation).
We can therefore envisage its use in a strategy for the deployment of a self-service decision-making system, by redefining the prerogatives of the players.
IT teams will be able to focus on the governance of the data platform and user teams on the implementation of their BI needs.
Analysis of the SAP roadmap :
Lumira and Design Studio: A step towards streamlining SAP reporting tools!
In Q2 2016, SAP announced the merger of the technology platforms supporting Lumira and Design Studio, two of its flagship tools. These two tools, which address different business issues, will be equipped with a single technological base allowing for increased convergence and improved TCO. Other redundant tools will be discarded.
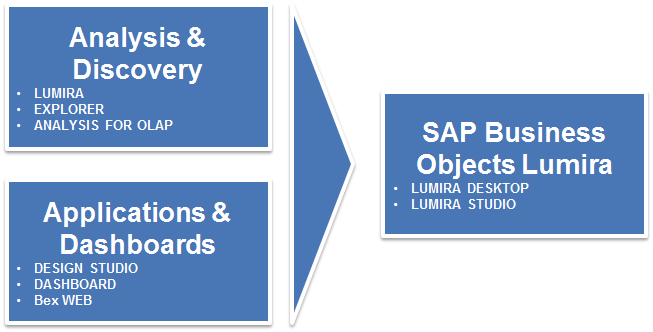
Fig 10. Convergence of tools
Lumira Desktop is a data visualisation and data discovery tool, while Lumira Studio (formerly Design Studio) is an application-oriented dashboard tool (Pixel Perfect).
This technological union allows SAP to gain clarity and rationalise its reporting offer. To understand this convergence it is important to note that the two front-end (client) tools will remain. Only the server add-on will be common:
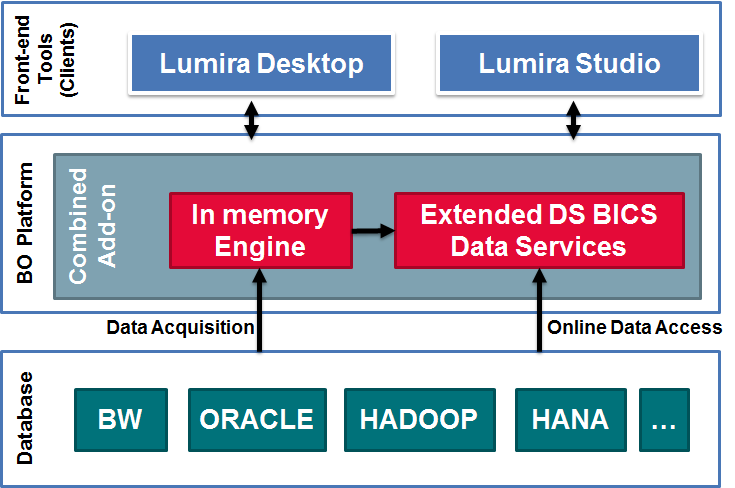
Fig 11. Architecture Overview
In addition to the reduction of the total cost of ownership due to the merging of the add-on server (deployment, updates, monitoring, etc.), SAP is banking on the adoption of "Fiori like" tools built around a user interface featuring advanced ergonomics that integrates natively with the SAP BW and SAP HANA solution.
This investment by the editor in these reporting solutions allows historical clients to be supported in this new technological leap towards their digital transformations.